
Budget Monitoring & Alert
Anomaly Detection
Anomaly Detection continuously tracks each billing target’s spend and uses statistics to flag costs that deviate significantly from its normal range, alerting budget managers early so they can respond before the impact grows. It’s the counterpart to budgets: budgets tell you when you cross a line you set, while anomaly detection surfaces unexpected jumps you didn’t think to watch for.
Availability
Section titled “Availability”Anomaly Detection is included on Starter and Standard.
What it watches
Section titled “What it watches”Anomalies are detected per billing target: an AWS member account, a GCP project, or an Azure resource group. For each target, LumiTure compares the latest daily cost against that target’s own recent history.
How detection works
Section titled “How detection works”For each billing target, LumiTure compares the latest daily cost against that target’s own recent history rather than against a threshold you set, so what counts as unusual is specific to that target. A target with only a little history is judged more cautiously.
Sensitivity is what you tune when alerts feel too noisy or too quiet. High makes LumiTure react to smaller deviations, so you get more alerts; Low flags only the clearest cases; Medium, the default, sits between the two. Only Admins can change it, in Alert Settings; everyone else sees the level currently in force above the Alert List.
Filtering and alerts
Section titled “Filtering and alerts”- Targets with very small daily spend are skipped, to avoid noise from small amounts.
- Multiple anomalies on the same day are combined into a single notification.
- Targets that are flagged and aren’t filtered out trigger an email alert to budget managers.
Group visibility
Section titled “Group visibility”If a resource is already assigned to a T1 / T2 group when an anomaly occurs, you’ll see that anomaly even if the resource is later assigned to other groups too. (A resource that wasn’t assigned to a given group at the time of the anomaly won’t show it there retroactively.)
The page
Section titled “The page”Anomaly Detection sits under Budget Monitoring & Alert and has two parts:
- Alert List: view the anomalies within your authorized scope.
- Alert Setting: configure detection alerts (Owner / Admin only).
The list shows resources with a detected anomaly in the last 30 days within your scope, based on the alert settings your Admins configured. Each row gives you the resource name and ID, the actual cost, the anomaly date, and the groups the resource is assigned to; the badge above the table shows the current detection state and sensitivity, for example Detection Enabled (Sensitivity: Medium).
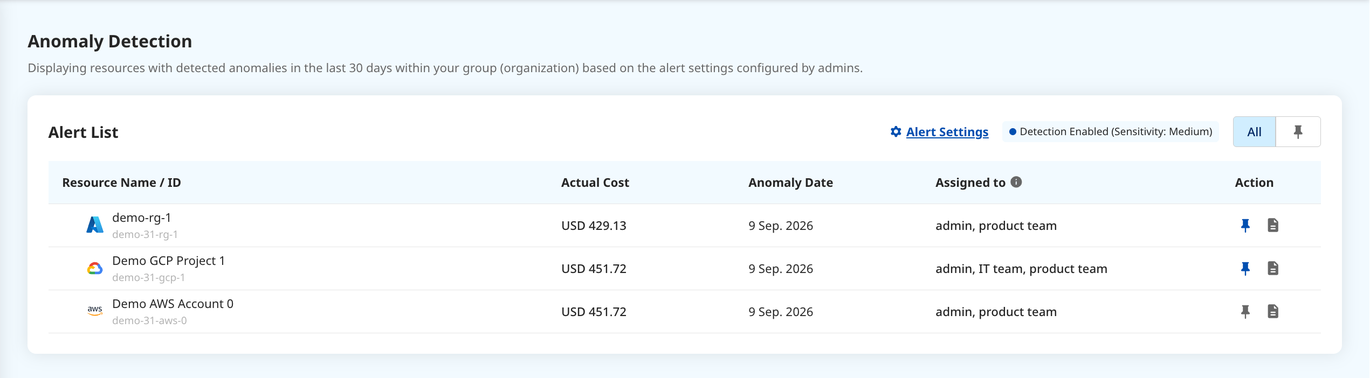
A resource with several anomalies in the window is rolled up into one row: the number beside the cost tells you how many, and the arrow at the start of the row expands them.
Pin an alert you’re tracking, then switch the toggle at the top right from All to the pin to show only pinned alerts. The report icon in the Action column opens that alert’s report. Owner and Admin also get an Alert Settings link above the table.
Reading an alert report
Section titled “Reading an alert report”Open the report from the Action column to see what drove the anomaly.
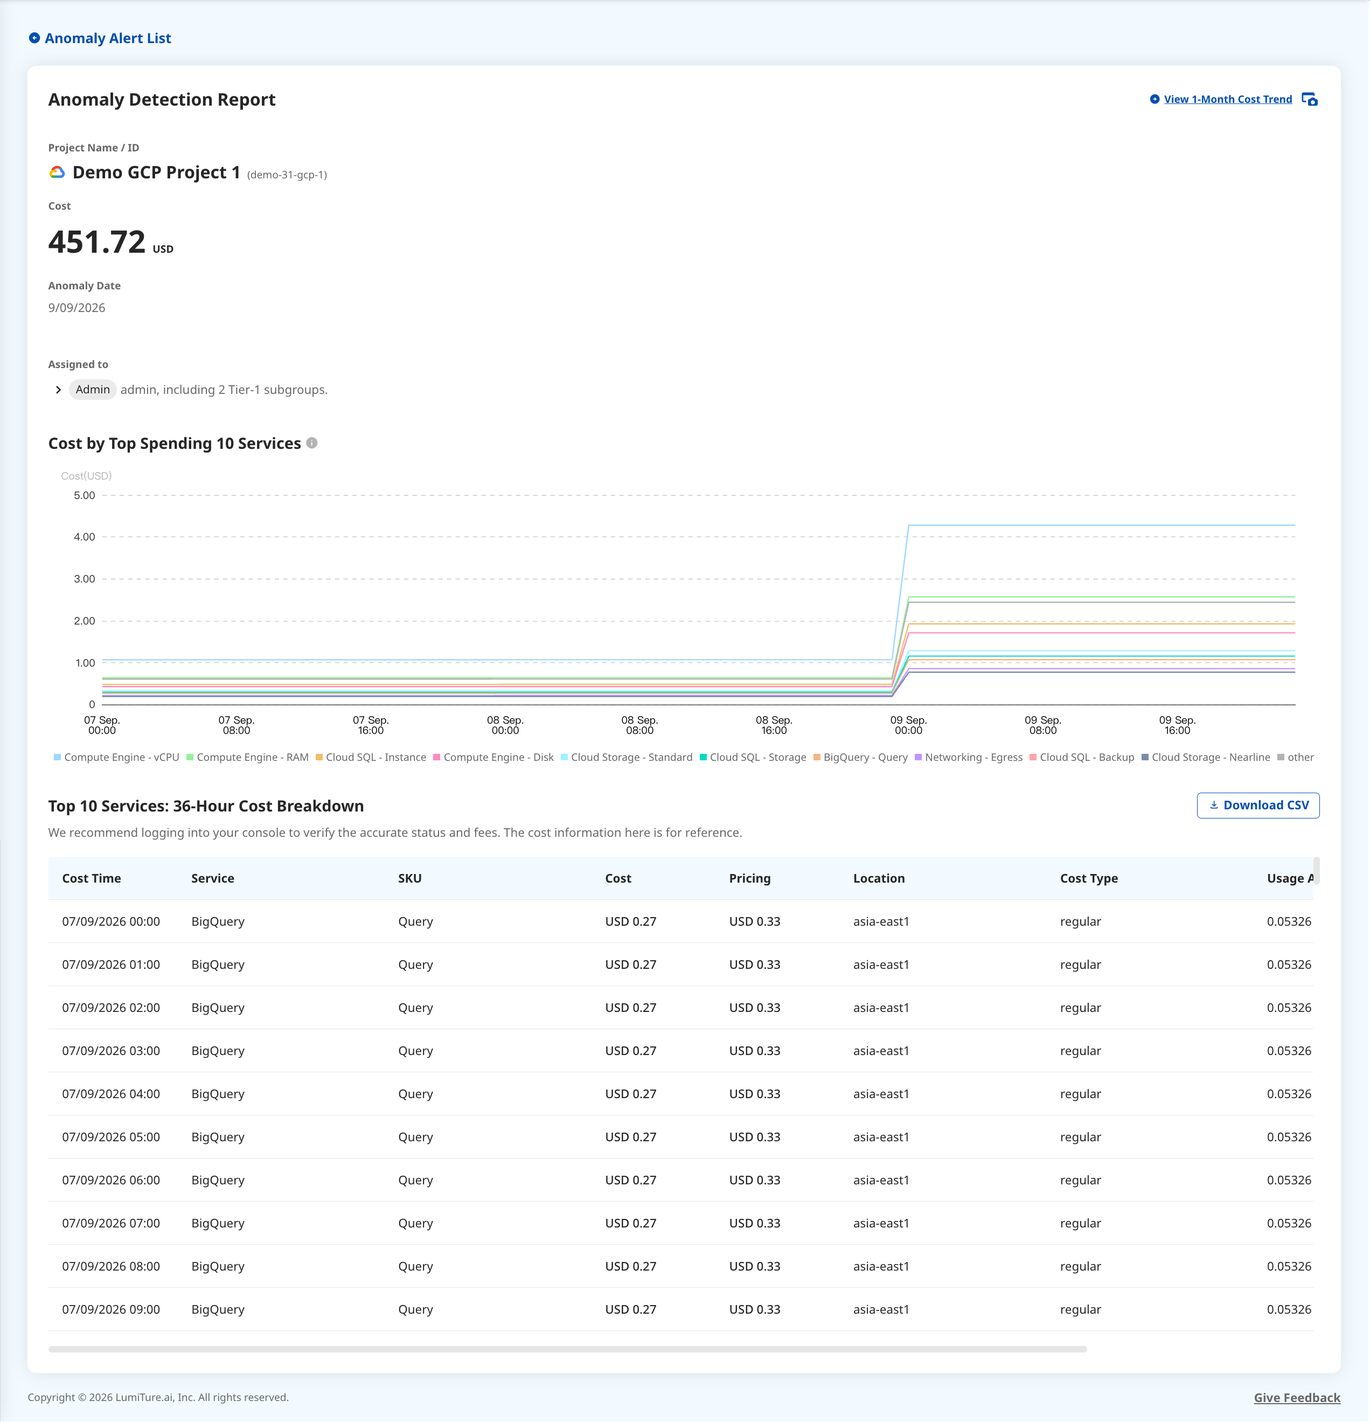
- The header repeats the account name and ID, the cost, the anomaly date, and the groups the resource is assigned to.
- Cost by Top Spending 10 Services plots the ten highest-spending services around the anomaly, so you can see which one jumped. View 1-Month Cost Trend opens the wider trend for the same target.
- Top 10 Services: 36-Hour Cost Breakdown lists those services hour by hour, with usage type, region, and purchase option. Download CSV exports the table.
Use these figures to narrow down the cause, then confirm the exact status and charges in your cloud console.
Permissions
Section titled “Permissions”| Role | Access |
|---|---|
| Owner & Admin | Configure Alert Settings, and view the Alert List |
| T1 / T2 Manager & Member | View the Alert List within their authorized scope |