
Dashboard
Cost Dashboard
本頁內容尚未翻譯。
Cost Dashboard is where you explore your cloud costs in detail, across dimensions and over time, to spot spending patterns, decide where to optimize, and export the data to share with stakeholders. Where Overview gives you the headline, Cost Dashboard is the workbench for the actual analysis.
Availability
Section titled “Availability”Cost Dashboard is included on every plan. The data you can see is scoped to your role: Admins see the whole organization, while Managers and Members see their own group’s resources.
Cloud tabs
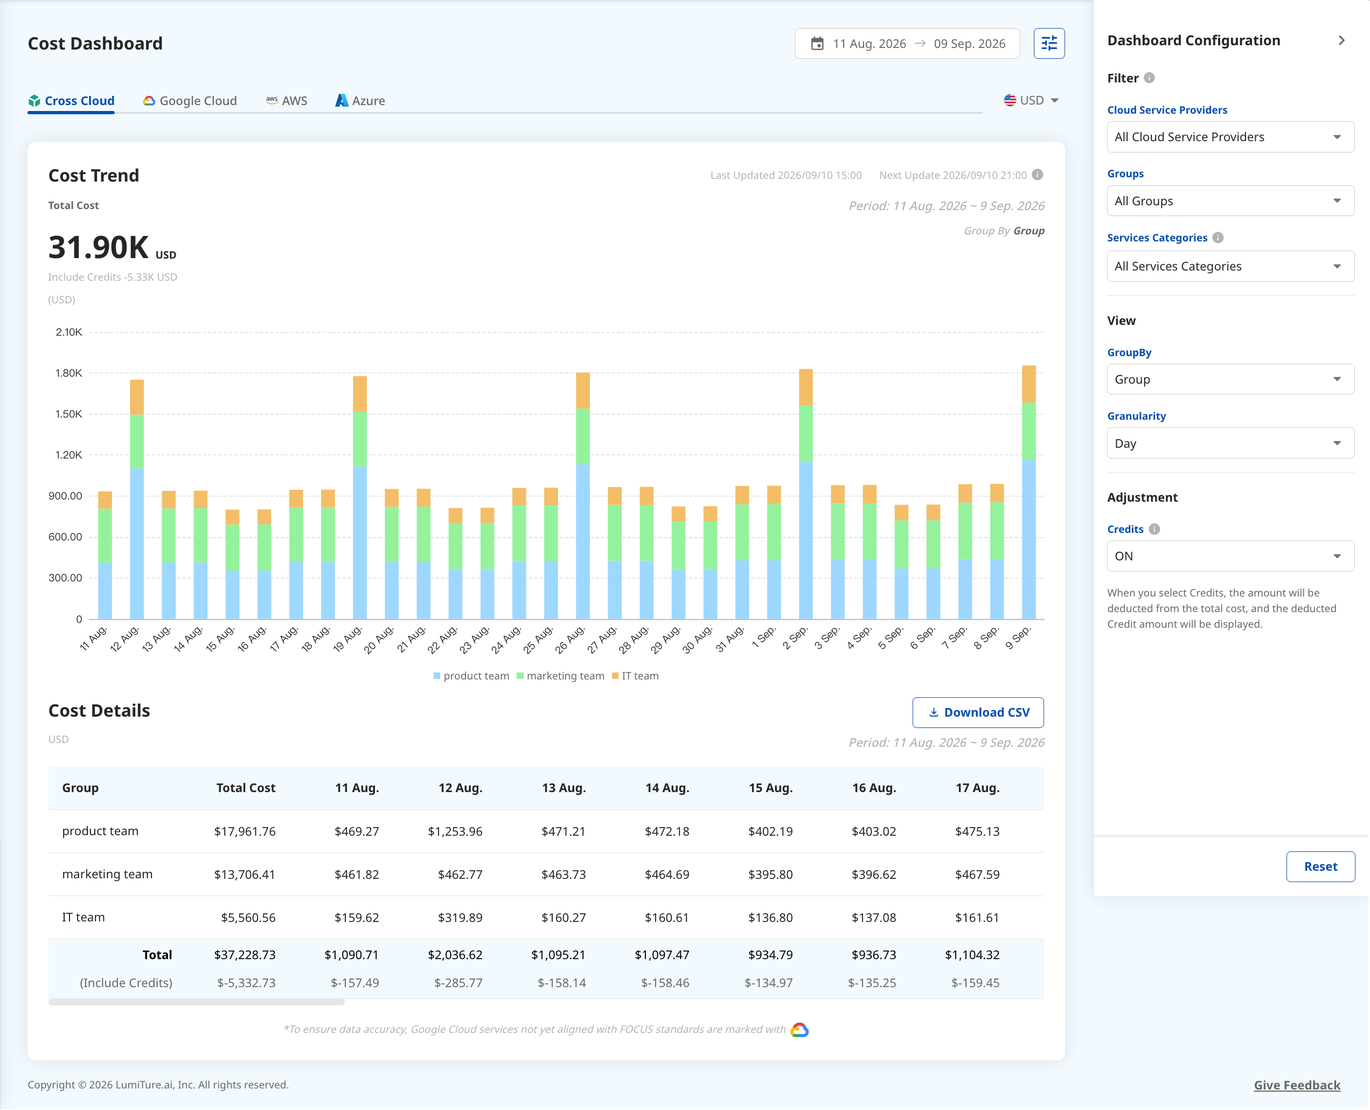
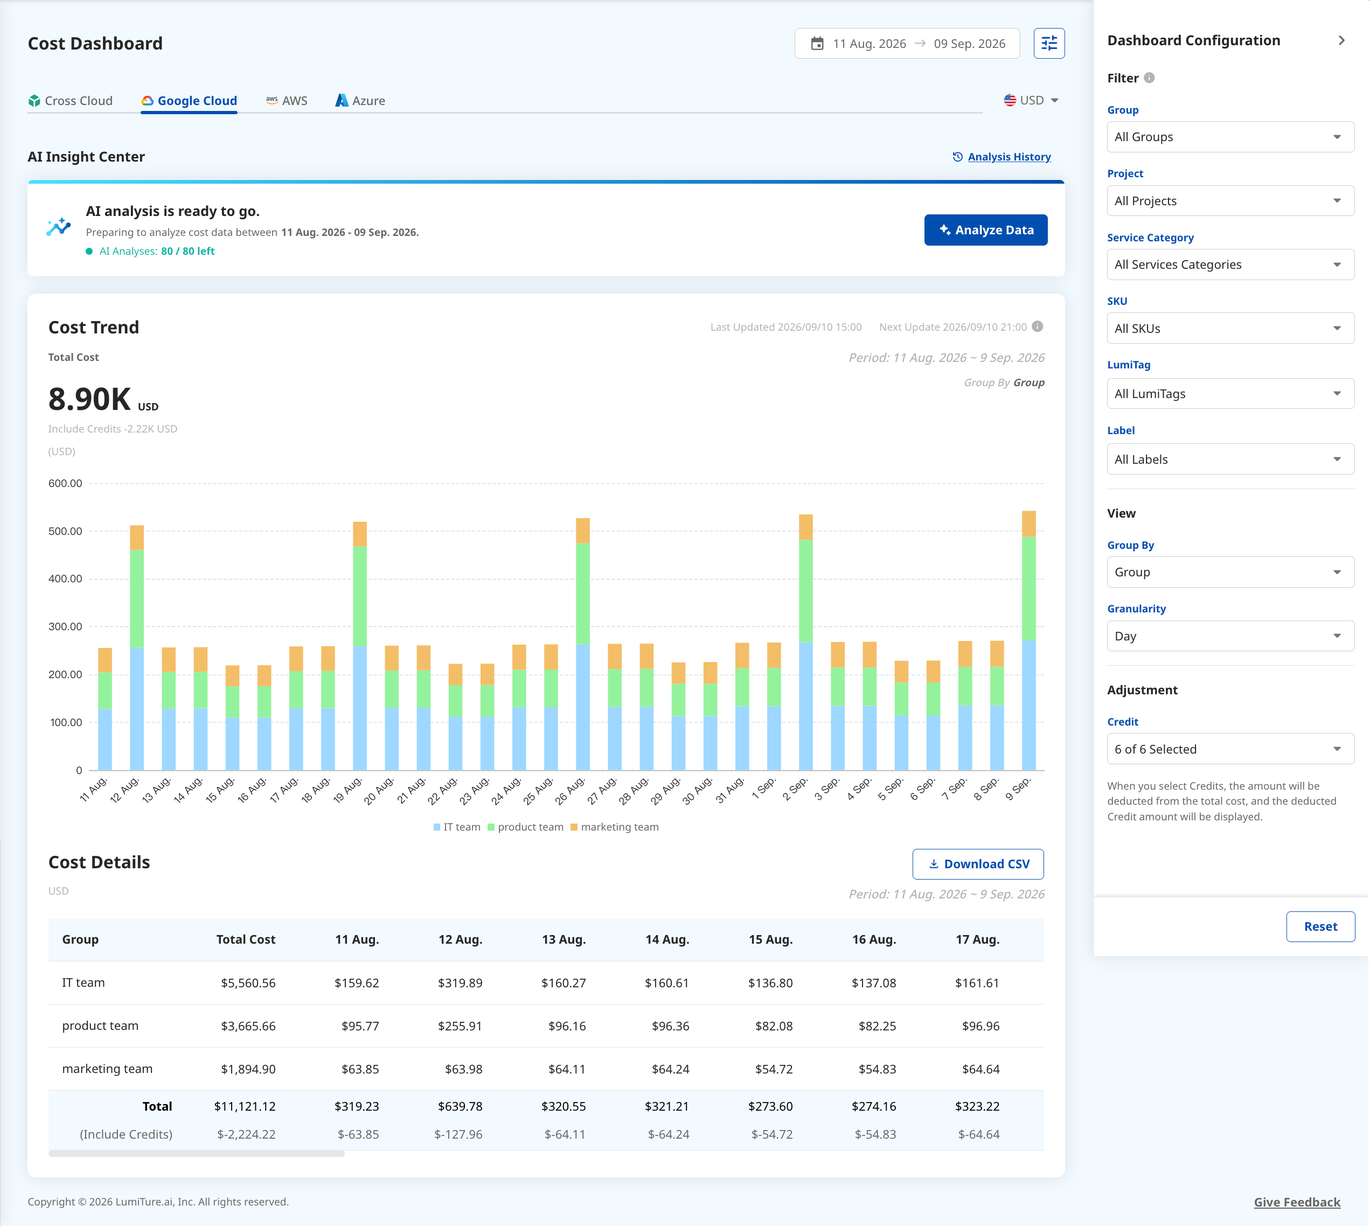
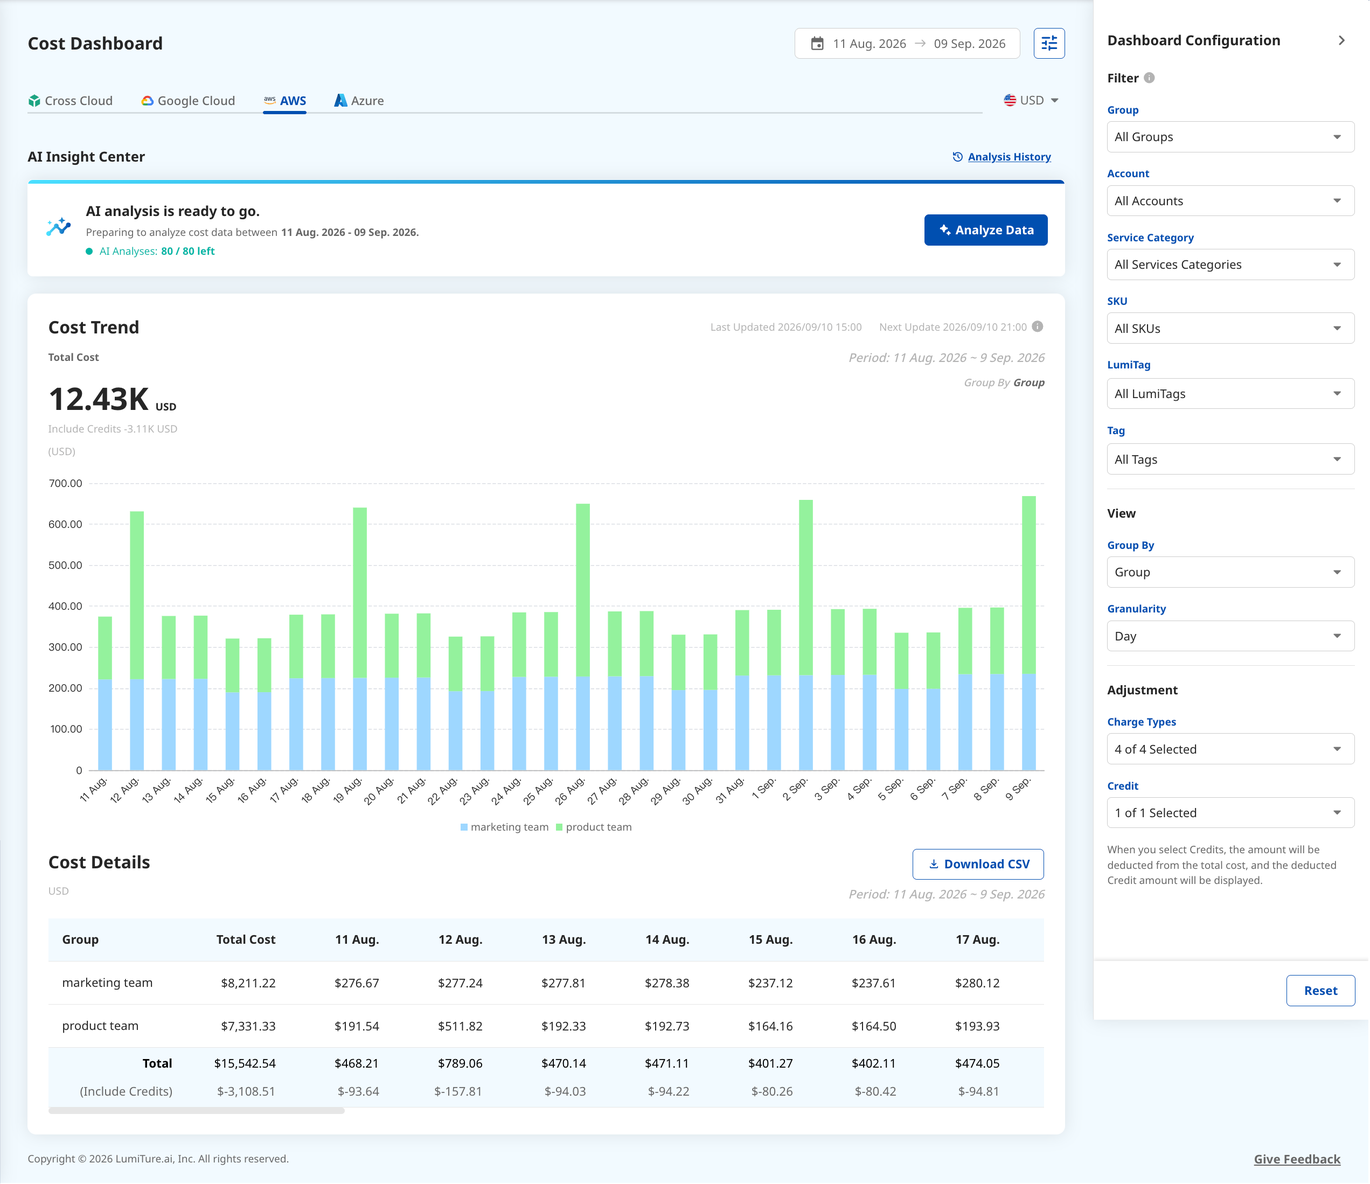
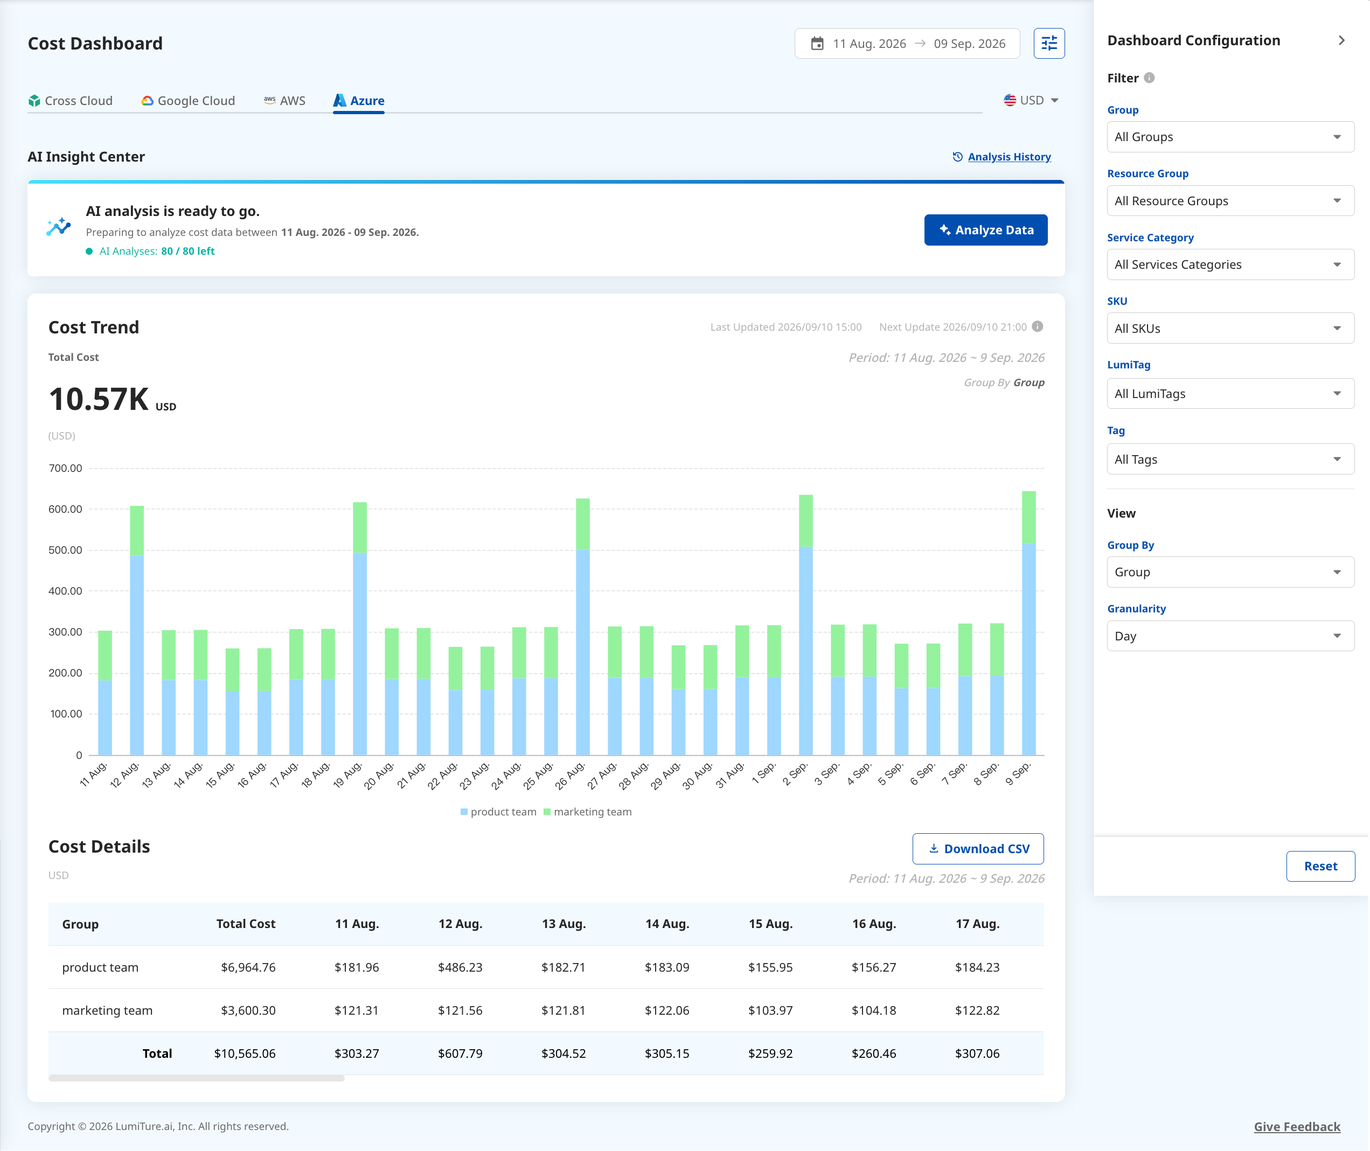
Section titled “Cloud tabs”The dashboard leads with the Cross Cloud tab, a combined view across all three clouds, followed by the Google Cloud, AWS, and Azure tabs for each cloud on its own. Each has the same layout; only the available Group By dimensions and filters differ, because each cloud exposes different billing fields (Cross Cloud uses only the dimensions shared across clouds). Amounts are shown in USD. Settings you change (Group By, filters) are kept while you switch tabs within the page, but reset to defaults once you leave and come back.
Choosing the time range
Section titled “Choosing the time range”The default view is the last 30 days. Quick options cover last 7 days, last 30 days, this month, and last month, and you can pick a custom date range.
Cost trend
Section titled “Cost trend”- The Total Cost card shows the total for the selected range and filters, the same figure the table totals to.
- The bar chart plots daily or monthly cost for the range, stacked by your Group By dimension. Items with a value of zero aren’t drawn on the chart, though they still appear in the table.
Filtering
Section titled “Filtering”Filters combine with AND: a resource must match every active filter, and an unset filter counts as “all”. The filters you get depend on which tab you’re on. All four share Groups, Services Categories, and Credit; each native cloud adds its own billing fields plus LumiTag, while Cross Cloud stays the leanest (no SKU, native tags, or LumiTag).
| Tab | Filters on that tab |
|---|---|
| Cross Cloud | Cloud Service Providers, Groups, Services Categories, Credits |
| Google Cloud | Groups, Projects, Services Categories, SKUs, Label Keys, LumiTag, Credit |
| AWS | Groups, Accounts, Services Categories, SKUs, Tag Keys, Charge Types, LumiTag, Credit |
| Azure | Groups, Resource Groups, Services Categories, SKUs, Tag Keys, LumiTag, Credit |
Grouping by dimension (Group By)
Section titled “Grouping by dimension (Group By)”Group By decides how costs are broken down. The default is Organization (for Admins) or Group (for Managers / Members). The dimensions available also depend on the tab. Cross Cloud is limited to what all three clouds share, so it has no SKU, native tags, or LumiTag:
| Tab | Group By dimensions |
|---|---|
| Cross Cloud | Organization, Cloud Service Providers, Group, Services Categories |
| Google Cloud | Organization, Group, Services Categories, Project, SKU, Label Key, LumiTag |
| AWS | Organization, Group, Services Categories, Account, SKU, Tag Key, LumiTag |
| Azure | Organization, Group, Services Categories, Resource Group, SKU, Tag Key, LumiTag |
When you group by a Label Key or Tag Key, the chart and table break down by that key’s values. LumiTag groups by your virtual tags.
Cost details and export
Section titled “Cost details and export”Below the chart, the Cost Details table lists costs by your Group By dimension, with the period total and a per-day or per-month breakdown, sorted by cost. Export CSV downloads the current view, and it includes metadata (export time, the applied filters, the time range, and who exported it) so the slice is reproducible.
AI Insight Center
Section titled “AI Insight Center”The AI Insight Center answers the questions you actually have when you look at a cost, is this expected, whose is it, how does it compare, what should I do.
- Set a date range and click Analyze Data. The analysis uses the filters as they were at the moment you clicked; you can keep adjusting the dashboard while it runs without changing the result.
- Cost Summary states what you spent this period versus the mirrored prior period (the same number of days immediately before), and the percentage change.
- Cost Drivers identifies the biggest dimension for the period and its top sub-items, so you can see what moved.
- Results can be re-analyzed, expanded, and pinned. Analysis History keeps your recent runs (last 60 days, up to 10), and you can pin up to 3.
Permissions
Section titled “Permissions”Everyone can open Cost Dashboard. Data is scoped by role: Admins see the whole organization; T1 and T2 Managers and Members see their own group’s resources. Group By and Filter offer the group levels your role can reach (Admins to T1, T1 Managers to their T2).
Notes & edge cases
Section titled “Notes & edge cases”| Situation | Behavior |
|---|---|
| No cloud resources authorized | The page is empty and points you to Authorization List. |
| A filter has nothing selected | Treated as “all”. |
| A project / resource group has no name | Shown with a placeholder name; its ID is still displayed and it’s listed last. |
| An item’s value is zero | Omitted from the chart, but still shown in the table as 0. |
| A cloud isn’t connected yet | Its tab shows an empty state. |