Dashboard
Executive Insights
本頁內容尚未翻譯。
Executive Insights gives leadership a view of whether cloud investment is paying off — return on investment and the KPIs that matter to a CFO — so you can decide if spend needs to be reallocated. Figures are shown by month and accumulate across your fiscal year.
Availability
Section titled “Availability”Executive Insights (including Fiscal Settings) is a Standard-plan feature — it isn’t available on Starter. Only Owner / Admin can open it, because the whole page runs off organization-level finance baselines you set in Fiscal Settings (also Owner / Admin only).
How the numbers accumulate
Section titled “How the numbers accumulate”Figures are shown by month and are cumulative from the start of your fiscal year to the selected month (up to 12 months). Each company’s fiscal year can start in a different month, set in Fiscal Settings. Data updates on the 10th of each month for the previous month, so the month picker only lets you select months that have complete data.
Fiscal Settings
Section titled “Fiscal Settings”Fiscal Settings is where you enter the financial baselines the page’s KPIs are calculated from, month by month across the fiscal year. If a required field is empty, Save is blocked and the main page shows an empty-state placeholder rather than guessing. Active customers is optional — leave it blank and Save still goes through; only Cloud Cost per Customer skips that month. If the fiscal year you picked has no cost data yet, the page shows empty states rather than failing. Settings become uneditable and drop out of the picker after two years, so export anything you want to keep.
Cloud Value Realization (CVR)
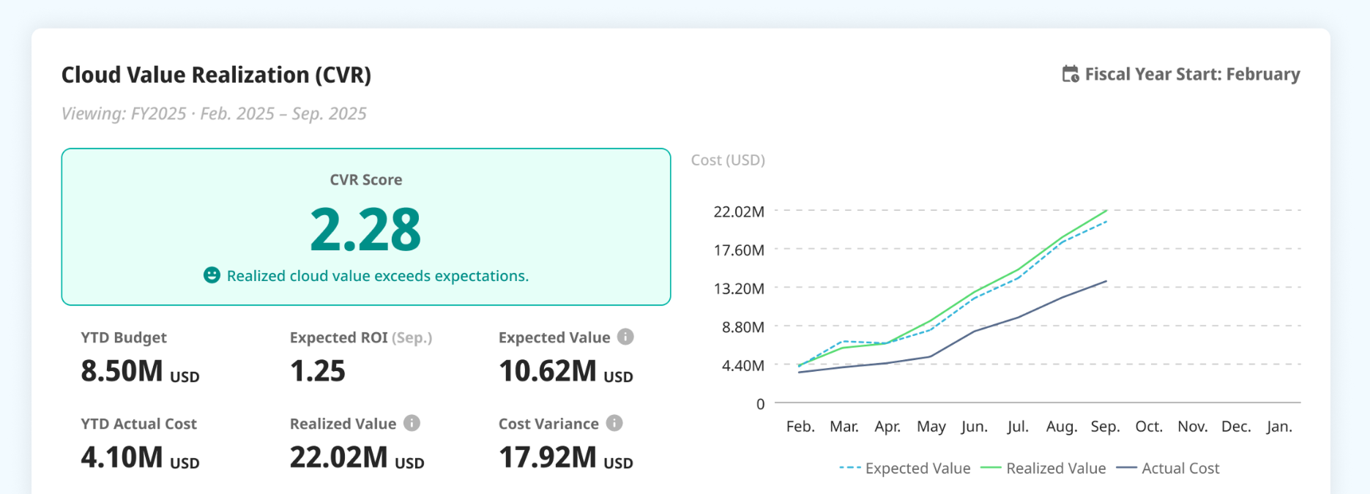
Section titled “Cloud Value Realization (CVR)”CVR is the headline: it weighs the value you are realizing against what the cloud actually costs. Above 1 means you’re realizing more value than the cost; 1 is on plan; below 1 is behind. It’s built from the baselines you enter and the actual cost LumiTure measures:
- Financial Budget — the cloud spend you planned (entered monthly, accumulated).
- Expected ROI — the value expected per unit of spend (entered monthly).
- Expected Value: the value you planned to realize across the fiscal year.
- Actual Cost — your real cloud total, accumulated from the fiscal-year start.
- Realized Value and Cost Variance round it out.
A line chart tracks Expected Value vs. Realized Value vs. Actual Cost over the fiscal year.
Key Metrics
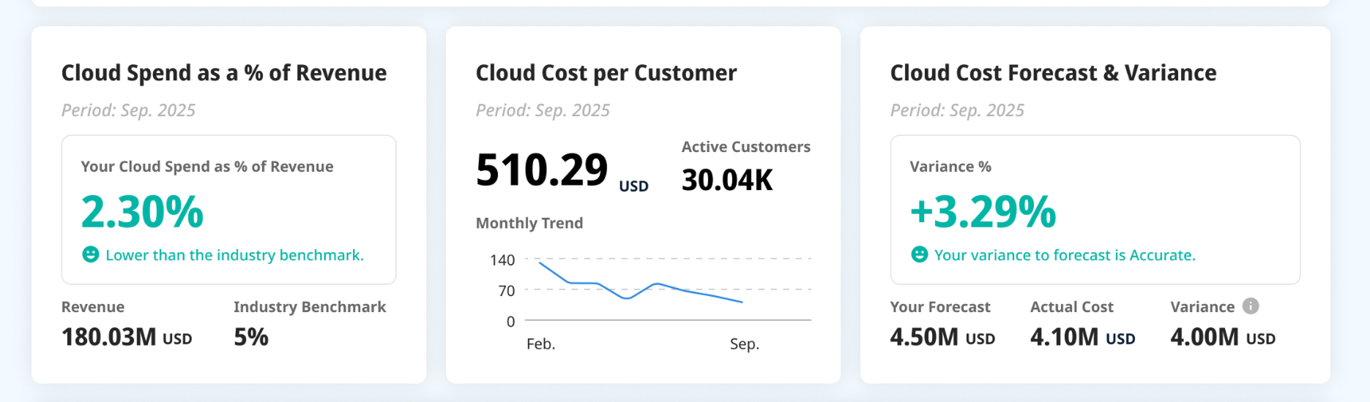
Section titled “Key Metrics”- Cloud Spend as % of Revenue — actual cost over revenue, compared to an industry benchmark you select; it flags when you’re above the benchmark.
- Cloud Cost per Customer — that month’s cloud cost divided by active customers; the healthy trend is downward. Active customers is optional, so months you leave blank are skipped and the line breaks at that point while the rest of the page carries on.
- Forecast & Variance — forecast minus actual, with an accuracy band showing how close the forecast landed.
Team Spendings
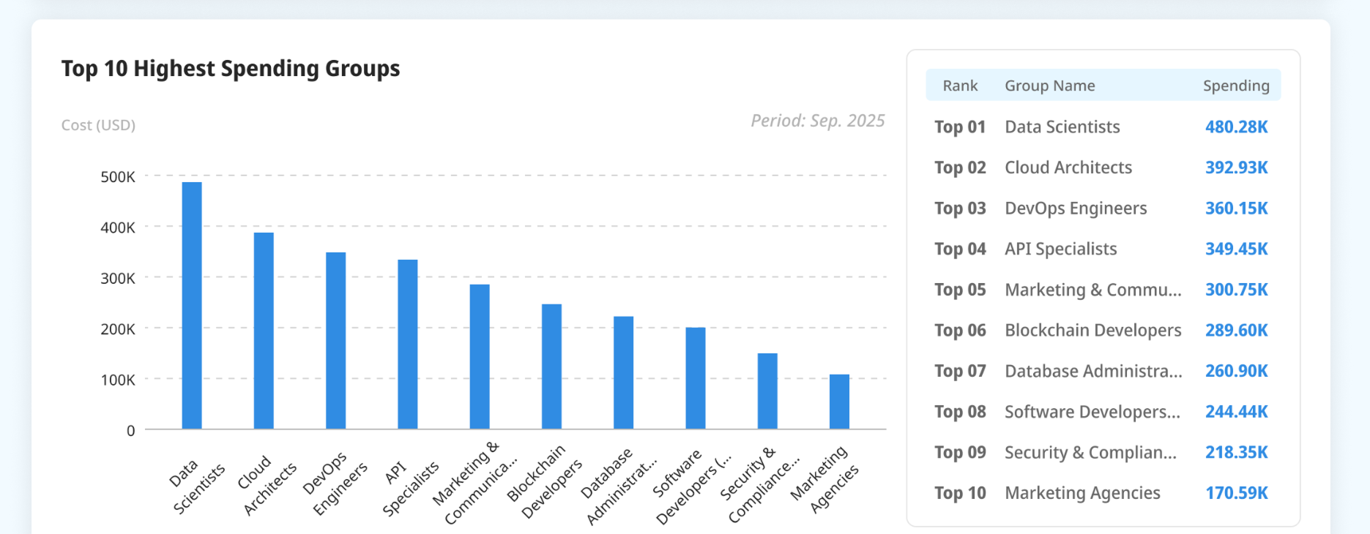
Section titled “Team Spendings”- Top 10 Highest Spending Teams — the biggest-spending groups this month.
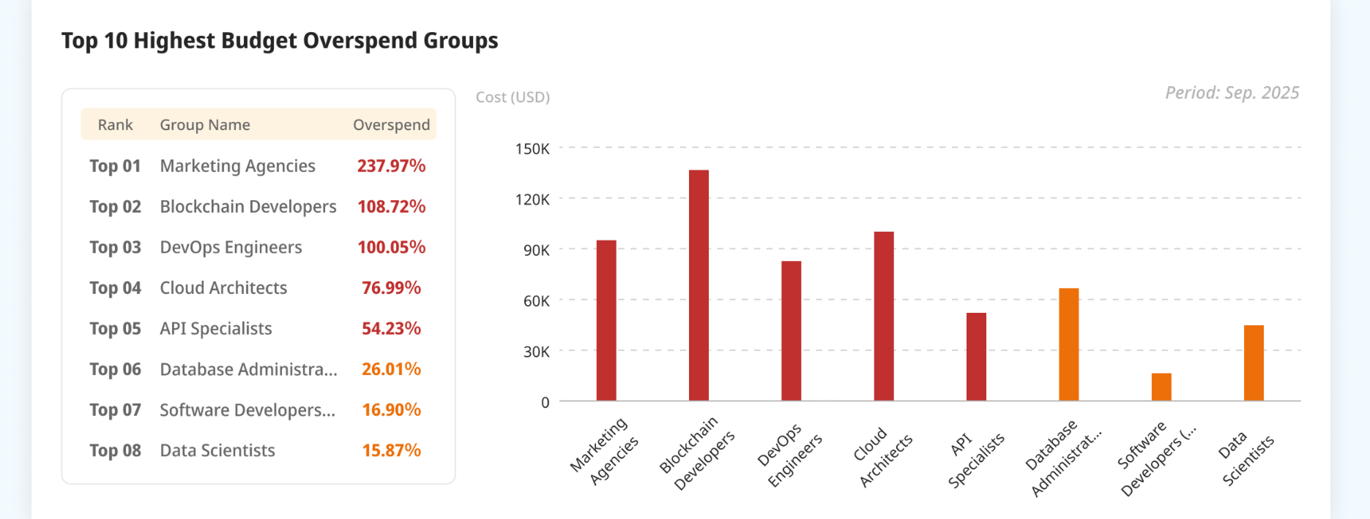
- Top 10 Highest Budget Overrun Teams — the groups furthest over budget, where the budget baseline comes from General Budget.