
Overview
Overview
本頁內容尚未翻譯。
Overview is the dashboard you land on when you sign in. It gives you an at-a-glance view of your cloud cost trend, how close you are to budget, your highest-spending teams, and your spend across clouds: the starting point for deciding whether you’re overspending, which teams are driving it, and whether to act.
Availability
Section titled “Availability”Overview is included on every plan, and every role can open it; the data is simply scoped to what each role can see. All plans can currently view up to the last three years of data.
The Overview dashboard
Section titled “The Overview dashboard”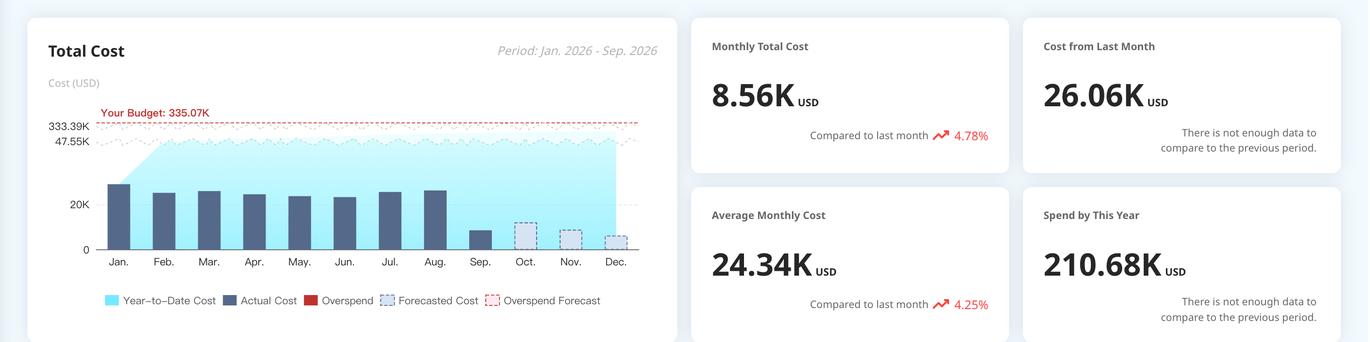
At the top of the page you switch the year and month and the currency (USD by default), and see the Last Updated / Next Update times. Changing the year or month updates every chart and card on the page at once.
Total Cost chart
Section titled “Total Cost chart”- Twelve monthly bars with a cumulative area chart, plus a Budget Line at the top (the annual budget total; hidden if no budget is set).
- Solid bars are actual cost; dashed bars are forecasted cost. The current month’s bar shows the month-to-date actual value.
- Forecasting (annual overspend warning): future, un-invoiced months are projected into the chart. Months where your spend is heading past the annual budget are flagged, so you can see trouble coming before it lands.
- Forecasting turns on once you have enough history; before that, no forecast is shown.
KPI cards
Section titled “KPI cards”| Card | Definition | Compared against |
|---|---|---|
| Monthly Total Cost | Month-to-date spend | The same period last month |
| Cost from Last Month | Total spend for the previous month | The same month last year |
| Average Monthly Cost | Average monthly spend over the past 12 months (excluding the current month) | The previous month’s result |
| Spend by This Year | Year-to-date spend | The same period last year |
Month-over-month comparisons account for month length. A change therefore reflects real spending, not how many days the month happened to have.
Choosing the period
Section titled “Choosing the period”The year / month picker at the top covers the current year plus the two before it (three years); periods without data show “no data”. Picking a month pulls the full month’s data, and everything below, Top 10 and Cost by Cloud, follows the selection. A Reset returns you to the current month.
Top 10 Highest Spending Team
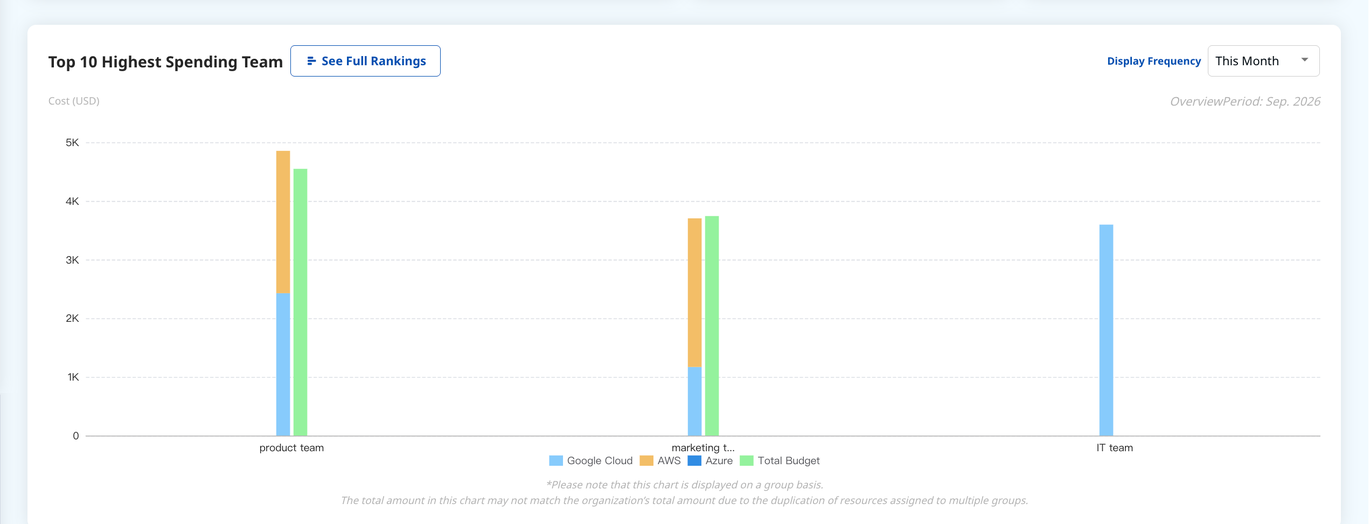
Section titled “Top 10 Highest Spending Team”- Shows the ten highest-spending groups for the period, ranked by cost. See Full Rankings opens the complete list.
- Each group has two bars: actual spend (segmented by Google Cloud / AWS / Azure) and its budget for the period (shown only if set).
- Display Frequency switches between Monthly (the selected month) and Yearly (year-to-date through that month).
- Rankings follow a parent-sees-child rule: Owner / Admin see T1 groups, T1 sees its T2 groups, and T2 has no lower level, so this chart is hidden for them.
- Because a resource can be assigned to more than one group, these totals may not match the organization total; a note under the chart says so. Hovering a group shows its per-cloud cost and budget; clouds you aren’t authorized for aren’t shown.
Cost by Cloud
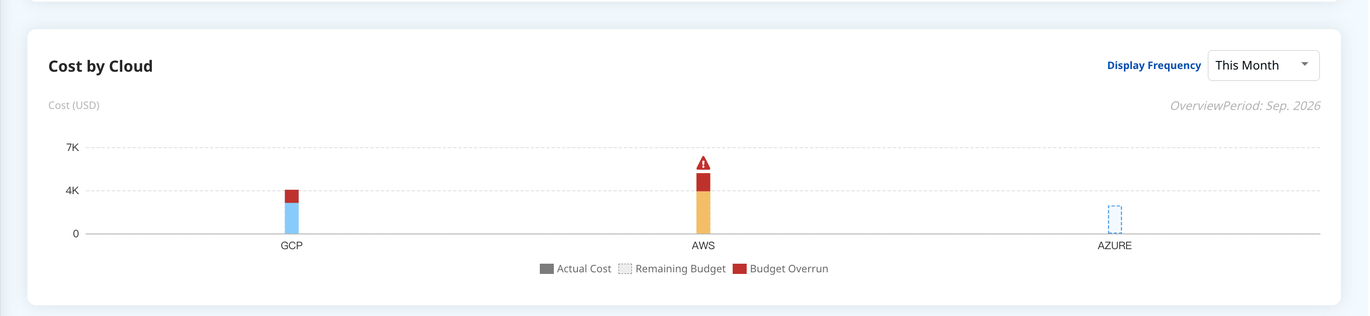
Section titled “Cost by Cloud”One bar per cloud: solid is actual spend, dashed is remaining budget for the period, and a colored segment marks a budget overrun. Hover to see Actual Cost, Budget, and Remaining Budget.
Cost by FOCUS Framework
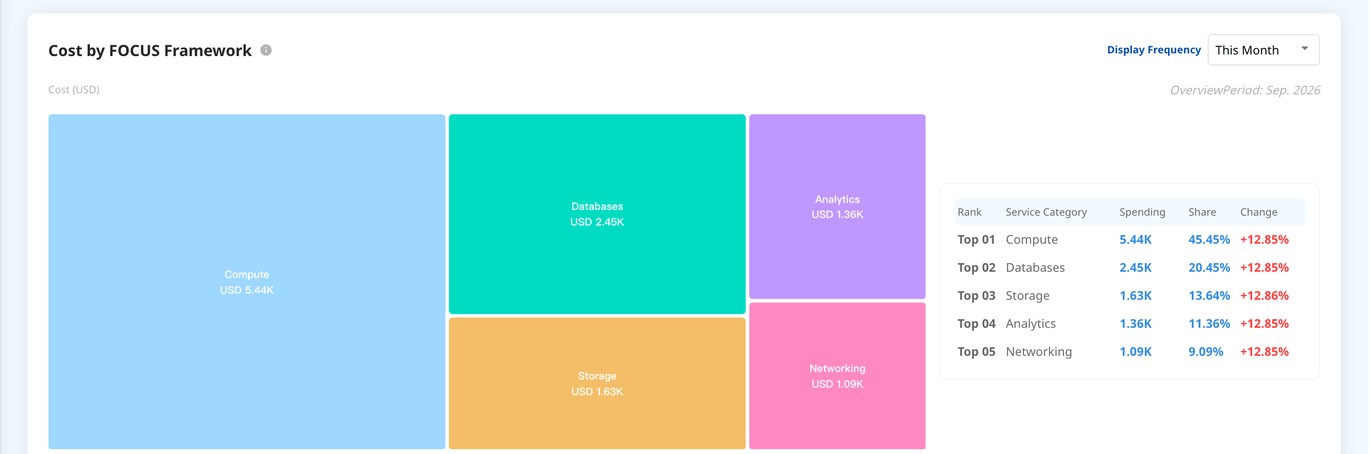
Section titled “Cost by FOCUS Framework”Breaks spend down by FOCUS service category (Compute, Storage, Machine Learning, and so on), with a table listing the top categories and their Spending, Share, and Change.
Categories follow FOCUS 1.0, the FinOps Foundation’s open cost and usage specification. Billing data from Google Cloud, AWS and Azure is normalized into one FOCUS-shaped dataset, so cost from all three clouds can be queried and grouped in one place.
What each role sees
Section titled “What each role sees”Everyone can open Overview, but the data is scoped: Owner / Admin see the whole organization, T1 Managers and Members see their T1 group, and T2 Managers and Members see their T2 group (with no group-ranking chart, since there’s no tier below them).